I often point out how many overrate the importance of goaltending, and that plenty of good teams have had success with average goalies. However, that certainly does not mean bad goaltending cannot be very costly in some situations. I think there have been quite a few examples of very good teams who were dominant in the regular season but found themselves at a disadvantage when they went up against strong playoff opponents getting much better play between the pipes.
To try to identify some teams that were let down by goaltending, I looked at which teams had the best adjusted win threshold over five consecutive years without winning a Stanley Cup in that time span:
1. Boston Bruins (1974-1978) .849
2. Detroit Red Wings (1992-1996), .853
3. Boston Bruins (1980-1984), .863
4. New York Rangers (1971-1975), .864
5. St. Louis Blues (1998-2002), .865
6. Philadelphia Flyers (1976-1980), .865
7. Buffalo Sabres (1974-1978), .866
8. Ottawa Senators (2001-2006), .868
9. Calgary Flames (1990-1994), .871
10. Philadelphia Flyers (1996-2000), .871
Four of these teams won a Cup either shortly before or shortly after this particular streak, but six of them never won a single Championship despite putting together an excellent group of skaters.
Most of these teams may very well have won with a better netminder, but there are two legitimate reasons why that might not have been the case: Strength of opposition and the playoff performance of the rest of the team.
Sometimes even great teams are left playing second fiddle to an even greater team. The 1970s Bruins and 1970s Sabres teams had the misfortune of running up against the great Flyers and Habs teams of that decade. The 1980s Calgary Flames are another classic example. Despite averaging an .870 adjusted win threshold for an entire decade (1984-85 to 1993-94), the Flames won just a single Stanley Cup. I can sympathize with having to compete against a prime Wayne Gretzky, but the early '90s Flames don't have the same ready-made excuse of simply having a more powerful cross-province rival. That suggests more scrutiny needs to fall on the performance of Mike Vernon.
In other cases, it might have been the skaters that underperformed in the playoffs. For the most part, good regular season teams end up being good playoff teams, but there are some exceptions. One pretty clear example of that is the case of the Ottawa Senators. Ottawa's team save percentage actually improved from .910 in the regular season to .921 in the playoffs between 2001 and 2006. The team lost because they stopped scoring: Ottawa scored nearly a full goal per game higher in the regular season (3.27) than in the playoffs (2.29). That means Ottawa's adjusted win threshold went from an excellent .871 to a very average .905. Lalime and Emery may have had a few bad moments, but the goalies should not be the scapegoats for the Senators' spring collapses.
What do you think? Were these 10 teams let down by goaltending? Are there any other examples that did not make the list?
Tuesday, November 24, 2009
Sunday, November 15, 2009
Why Goalie Equipment Was Not Responsible for the Scoring Drop
I'm interrupting a series of posts on win thresholds to continue a discussion we had in one of the comment threads about goalie equipment. A lot of people make a big deal about the size of goalie equipment in the NHL, and the NHL is currently working on yet another attempt to "fix" this problem. Many see large goalie pads as the main reason for the low scoring rate, and feel that if more restrictions were put on equipment then the league would become significantly more high-scoring. I've seen some fans go so far as to argue that the main difference between the 1980s scoring environment and the scoring environment today is that goalies wear much larger equipment.
I think those claims are completely unfounded. The reasons for the rapid improvement in goalie numbers over the last two decades have been improved goalie technique and better defensive play. Goalie equipment size has been a minor factor.
The main proof for this is the way that the goalie crop turned over in the late '80s and early '90s. The old guys were phased out of the game, a new wave took over, and there was a rapid increase in the league-average save percentage. All of this happened before goalies started increasing the size of their equipment.
Patrick Roy is generally credited with popularizing the butterfly style. Roy played his first NHL game on February 23, 1985. At that time goalies spent most of their time on their feet, they relied on their limbs rather than their body to make saves, and they made skate saves and stacked the pads and hugged the post with their arms and did all the other traditional things goalies had been doing for years. Let's look at what happened to that group of netminders.
There were 66 goalies who played a game in that same 1984-85 season, including Roy. Their average age was 25.7 years old. Just 25 of them (38%, a little over one-third) were still in the NHL in the 1989-90 season, a mere five years later. Only 8 of those 25 were still in the NHL a decade later in the 1994-95 season. Only 2 of of those 8 performed at a high level compared to league average in the 1990s, Roy and John Vanbiesbrouck. Roy was the only one of them that won a Vezina Trophy in the 1990s, and he won his last award in 1992.
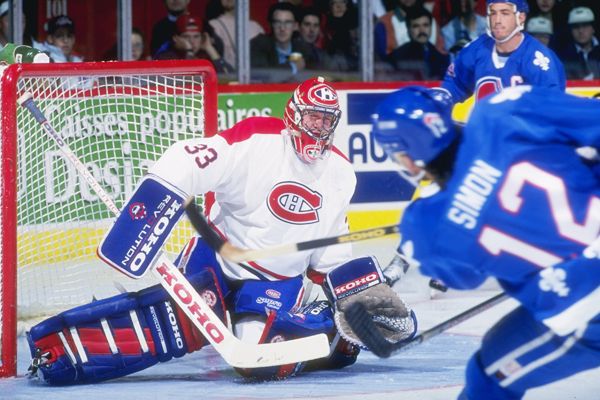
Let's fast forward a decade to that shortened 1994-95 season, and do the same analysis for that group of goalies. Remember, this is still before the equipment got huge. Here's a picture of Patrick Roy in action against the Quebec Nordiques during the 1993-94 season, for example. He has hardly any thigh-rise on his pads and his pants, chest protector and jersey all fit fairly snugly.
In 1994-95, 68 goalies played in the NHL, with an average age of 26.3. Jump ahead 5 years to 1999-00, as we did for the prior group, and we find that 44 of them are still in the league (65%, or about two-thirds). Not only that, but a dozen of them were still playing 11 years later when the league came back from the lockout for the 2005-06 season. Six out of the 9 Vezinas awarded from 2000-2009 went to goalies who were active in 1994-95, and that group included many of the top goalies of the 2000s.
Having established that the goalies from 1994-95 had much more longevity than the goalies from 1984-85, let's look at the average save percentages for those two seasons. I'll also throw in the average for 2003-04, the season with both the lowest average goals per game and the highest average save percentage of the so-called Dead Puck Era.
1984-85: .874
1994-95: .901
2003-04: .911
Power plays per game were at about the same level for all three seasons, 7.9 per game in 1984-85, 8.6 in 1994-95, and 8.3 in 2003-04. Some of the increase in save percentage would have been from defensive play, but most of it was because the goalies were better. League-wide defensive play also improved from 1994-95 to 2003-04, yet the league average save percentage only went up by .010, despite goalie equipment getting much larger. It is obvious that the more significant change happened between 1985 and 1995, not between 1995 and 2004.
We can also get a sense of the changing dynamic from 1985 to 1995 by comparing the save percentages of the goalies who were active in both periods. I chose to look at three year averages to avoid small sample sizes, including the year before and the year after for each goalie (i.e. 1984-86 and 1994-1996). There were 8 goalies in the group, but I dropped Roy since he only played 1 game in 1984-85 and therefore would really only have one season count. Roy played the modern technique anyway so his progress isn't really meaningful to what we want to track, which is how the older goalies adapted their games to a changing league.
1984-86: .886
1994-96: .900
There is a substantial improvement in the numbers. It is important to note, though, that this improvement was mostly being driven by the younger goalies in the group. The goalies who saw their numbers jump the most were Ken Wregget (.871 to .900), Tom Barrasso (.886 to .898), and especially John Vanbiesbrouck (.882 to .915), all of whom were 21 years old or younger in 1984-85. Not only were these goalies young and still not at their prime in the mid-'80s, but they already used some modern techniques or were able to adapt to the changing game.
Let's look at the older group of goalies, which includes Andy Moog, Grant Fuhr, Don Beaupre, and Kelly Hrudey. These goalies did not change their styles as much over the same period:
1984-86: .889
1994-96: .896
Despite seeing their save percentage numbers rise as a result of better defensive play in front of them, this group of four lost a ton of ground to the rest of the league during this period. They went from +.015 compared to league average in the mid-'80s to .002 below league average in the mid-'90s.
Let's compare that to the 1995 group. We want to look at the goalies who were still playing a decade later, so I picked out the 12 that played in the post-lockout NHL. I decided to compare their 1994-96 results to their numbers from 2002-04, since we want to look at seasons with no equipment restrictions.
1994-96: .907
2002-04: .911
That's just a slight increase. To be fair, we should remove Dominik Hasek, who is older than the rest of the group and is skewing the numbers with a mostly age-related decline from .926 to .914. Without the Dominator the group goes from .904 to .911, an increase of +.007. In a more defensive league with larger equipment, the increase in numbers is exactly the same as the increase we saw from the standup goalies from 1985-1995. In both cases, the league improved defensively over the period. Larger equipment would have had some small effect, but certainly not the game-changing impact that some would have you believe.
Finally, recent years have also showed us that there is not much of a relationship between equipment size and goalie play. After the lockout in 2005 there were new restrictions placed on goalie leg pads (reduced from 12" to 11") as well as glove and blocker sizes. Yet today the average save percentage in all game situations is back up to the same levels as it was in the early 2000s, despite the removal of most of the clutching and grabbing.
Just to recap, the league average save percentage went up by .037 from 1985 to 2004. Most of that improvement (.027) was already made by 1995, which was before the league-wide increase in goalie equipment size. The rest of the improvement coincided with an increasingly defensive league. When we look at the standup goalies who played in both 1985 and 1995, and compare their performance to goalies who played in both 1995 and 2006, we find that both groups increased their numbers by a similar amount even though only the latter group benefitted from huge equipment.
If I had to estimate and rank the factors that led to the change in league save percentage between 1985 and today, I would rank them in this order:
1. Improved goaltending technique (~.015-.020)
2. Improved defensive play (~.010-.015)
3. Goalie equipment size (~.005-.010)
The post-lockout crackdown on goalie equipment was still probably a good idea, but the continued focus on equipment size is in my view excessive and not something that will yield significant rewards. If the league wants to increase scoring, there are better alternatives to pursue.
I think those claims are completely unfounded. The reasons for the rapid improvement in goalie numbers over the last two decades have been improved goalie technique and better defensive play. Goalie equipment size has been a minor factor.
The main proof for this is the way that the goalie crop turned over in the late '80s and early '90s. The old guys were phased out of the game, a new wave took over, and there was a rapid increase in the league-average save percentage. All of this happened before goalies started increasing the size of their equipment.
Patrick Roy is generally credited with popularizing the butterfly style. Roy played his first NHL game on February 23, 1985. At that time goalies spent most of their time on their feet, they relied on their limbs rather than their body to make saves, and they made skate saves and stacked the pads and hugged the post with their arms and did all the other traditional things goalies had been doing for years. Let's look at what happened to that group of netminders.
There were 66 goalies who played a game in that same 1984-85 season, including Roy. Their average age was 25.7 years old. Just 25 of them (38%, a little over one-third) were still in the NHL in the 1989-90 season, a mere five years later. Only 8 of those 25 were still in the NHL a decade later in the 1994-95 season. Only 2 of of those 8 performed at a high level compared to league average in the 1990s, Roy and John Vanbiesbrouck. Roy was the only one of them that won a Vezina Trophy in the 1990s, and he won his last award in 1992.
Let's fast forward a decade to that shortened 1994-95 season, and do the same analysis for that group of goalies. Remember, this is still before the equipment got huge. Here's a picture of Patrick Roy in action against the Quebec Nordiques during the 1993-94 season, for example. He has hardly any thigh-rise on his pads and his pants, chest protector and jersey all fit fairly snugly.
In 1994-95, 68 goalies played in the NHL, with an average age of 26.3. Jump ahead 5 years to 1999-00, as we did for the prior group, and we find that 44 of them are still in the league (65%, or about two-thirds). Not only that, but a dozen of them were still playing 11 years later when the league came back from the lockout for the 2005-06 season. Six out of the 9 Vezinas awarded from 2000-2009 went to goalies who were active in 1994-95, and that group included many of the top goalies of the 2000s.
Having established that the goalies from 1994-95 had much more longevity than the goalies from 1984-85, let's look at the average save percentages for those two seasons. I'll also throw in the average for 2003-04, the season with both the lowest average goals per game and the highest average save percentage of the so-called Dead Puck Era.
1984-85: .874
1994-95: .901
2003-04: .911
Power plays per game were at about the same level for all three seasons, 7.9 per game in 1984-85, 8.6 in 1994-95, and 8.3 in 2003-04. Some of the increase in save percentage would have been from defensive play, but most of it was because the goalies were better. League-wide defensive play also improved from 1994-95 to 2003-04, yet the league average save percentage only went up by .010, despite goalie equipment getting much larger. It is obvious that the more significant change happened between 1985 and 1995, not between 1995 and 2004.
We can also get a sense of the changing dynamic from 1985 to 1995 by comparing the save percentages of the goalies who were active in both periods. I chose to look at three year averages to avoid small sample sizes, including the year before and the year after for each goalie (i.e. 1984-86 and 1994-1996). There were 8 goalies in the group, but I dropped Roy since he only played 1 game in 1984-85 and therefore would really only have one season count. Roy played the modern technique anyway so his progress isn't really meaningful to what we want to track, which is how the older goalies adapted their games to a changing league.
1984-86: .886
1994-96: .900
There is a substantial improvement in the numbers. It is important to note, though, that this improvement was mostly being driven by the younger goalies in the group. The goalies who saw their numbers jump the most were Ken Wregget (.871 to .900), Tom Barrasso (.886 to .898), and especially John Vanbiesbrouck (.882 to .915), all of whom were 21 years old or younger in 1984-85. Not only were these goalies young and still not at their prime in the mid-'80s, but they already used some modern techniques or were able to adapt to the changing game.
Let's look at the older group of goalies, which includes Andy Moog, Grant Fuhr, Don Beaupre, and Kelly Hrudey. These goalies did not change their styles as much over the same period:
1984-86: .889
1994-96: .896
Despite seeing their save percentage numbers rise as a result of better defensive play in front of them, this group of four lost a ton of ground to the rest of the league during this period. They went from +.015 compared to league average in the mid-'80s to .002 below league average in the mid-'90s.
Let's compare that to the 1995 group. We want to look at the goalies who were still playing a decade later, so I picked out the 12 that played in the post-lockout NHL. I decided to compare their 1994-96 results to their numbers from 2002-04, since we want to look at seasons with no equipment restrictions.
1994-96: .907
2002-04: .911
That's just a slight increase. To be fair, we should remove Dominik Hasek, who is older than the rest of the group and is skewing the numbers with a mostly age-related decline from .926 to .914. Without the Dominator the group goes from .904 to .911, an increase of +.007. In a more defensive league with larger equipment, the increase in numbers is exactly the same as the increase we saw from the standup goalies from 1985-1995. In both cases, the league improved defensively over the period. Larger equipment would have had some small effect, but certainly not the game-changing impact that some would have you believe.
Finally, recent years have also showed us that there is not much of a relationship between equipment size and goalie play. After the lockout in 2005 there were new restrictions placed on goalie leg pads (reduced from 12" to 11") as well as glove and blocker sizes. Yet today the average save percentage in all game situations is back up to the same levels as it was in the early 2000s, despite the removal of most of the clutching and grabbing.
Just to recap, the league average save percentage went up by .037 from 1985 to 2004. Most of that improvement (.027) was already made by 1995, which was before the league-wide increase in goalie equipment size. The rest of the improvement coincided with an increasingly defensive league. When we look at the standup goalies who played in both 1985 and 1995, and compare their performance to goalies who played in both 1995 and 2006, we find that both groups increased their numbers by a similar amount even though only the latter group benefitted from huge equipment.
If I had to estimate and rank the factors that led to the change in league save percentage between 1985 and today, I would rank them in this order:
1. Improved goaltending technique (~.015-.020)
2. Improved defensive play (~.010-.015)
3. Goalie equipment size (~.005-.010)
The post-lockout crackdown on goalie equipment was still probably a good idea, but the continued focus on equipment size is in my view excessive and not something that will yield significant rewards. If the league wants to increase scoring, there are better alternatives to pursue.
Thursday, November 12, 2009
The Goalies With the Hardest Jobs
Having seen which goalies had to do the least for their teams to win, let's look at the reverse side of the coin. Which goalies needed to be at their absolute best almost every game to keep their teams ahead on the scoreboard?
1. Ron Low, .920
2. Denis Herron, .915
3. Cesare Maniago, .914
4. Roberto Luongo, .913
5. Marc Denis, .912
6. Gary Smith, .911
7. Doug Favell, .911
8. Greg Millen, .911
9. Kevin Weekes, .910
10. Guy Hebert, .910
11. Bruce Gamble, .909
12. Jeff Hackett, .909
13. Jim Rutherford, .908
14. Gilles Meloche, .908
15. Mike Dunham, .908
16. Tomas Vokoun, .908
17. Mike Palmateer, .907
18. Ron Tugnutt, .907
19. Dwayne Roloson, .906
20. Manny Fernandez, .906
Just a reminder that these numbers are purely based on save percentage, and don't take into account the number of penalties taken or any shot quality effects. Some of these goalies would have therefore in reality had an easier or tougher time of it. Luongo, for example, has faced a high rate of power plays against throughout his career. On the other hand, Roloson and Fernandez wouldn't make the list if special teams were accounted for.
In contrast to the low win threshold group there are no Hall of Famers on this list, although Luongo should be considered to be on a Hall of Fame track by anyone but the most extreme Cup counter. If we extend the list, the first Hall of Famer that we would hit would be Gump Worsley at .904. The only other enshrined goalie with a number above .900 (the league average baseline that all numbers were adjusted to) is Tony Esposito's .901.
One good reason that we don't see many of the top goalies on this list is that good goalies usually end up on the better teams. Worsley would have made the top 10 based on his years in New York and Minnesota only, but he also played a few seasons on some great Montreal teams. As a Sabre Dominik Hasek would have narrowly missed making this list, but playing for the Senators and Red Wings pulled down his overall number.
I was expecting to see Ron Low first on this list since he is famous for having the worst career winning percentage in history. We also see all 3 of the "bad team goalies" named by Ken Dryden in "The Game" show up in the top 7 (Herron, Smith, Favell). If Dryden needed a fourth example he'd probably have picked Meloche, who also makes an appearance.
All of the goalies on this list were good enough to stick around in the NHL long enough to play at least 300 games. Some weren't particularly good, but most were solid goalies in poor situations. I think several of them are probably quite underrated based on their numbers, in particular Maniago, Hebert, Palmateer, and Vokoun. Just a caveat, though, that the observed relationship between team results and goalie results means that more work needs to be done trying to disentangle team effects from goalie performance for the 1960s and 1970s goalies.
Wednesday, November 11, 2009
The Goalies With the Easiest Jobs
Which goalies had the lowest career win thresholds? Win thresholds measure how effective a team is at scoring goals and preventing shots, so a low win threshold means that a team provides a high margin of error for a goalie. Even if they are playing poorly, the other team has a limited number of chances to score, and even if a few pucks end up in the back of the net the rest of the team might just outscore the opposition anyway. It's a nice safety margin to have for any goalie. The problem comes when people try to compare goalies based on win/loss records without taking those situations into account.
I ran the numbers for every goalie with 300+ games played since 1955 (for goalies who played part of their careers before 1955 I was only able to include the portion that came after because of the lack of data). It doesn't take a vast knowledge of hockey history to know that Ken Dryden is going to come out ranked #1, but the identities of the other goalies at the top of the list is of some interest. The numbers are adjusted to a baseline of .900. Here are the 20 goalies with the lowest career win threshold:
1. Ken Dryden, .850
2. Gerry Cheevers, .861
3. Michel Larocque, .868
4. Gilles Gilbert, .873
5. Chris Osgood, .873
6. Mike Vernon, .875
7. Andy Moog, .879
8. Patrick Lalime, .880
9. Jacques Plante, .881
10. Rick Wamsley, .881
11. Tim Cheveldae, .882
12. Pete Peeters, .882
13. Grant Fuhr, .882
14. Roman Turek, .883
15. Ed Giacomin, .884
16. Marty Turco, .885
17. Martin Brodeur, .886
18. Manny Legace, .886
19. Wayne Stephenson, .886
20. Ron Hextall, .887
There are 3 teams that are mainly responsible for the top 6 goalies on the list: The 1970s Canadiens, the 1970s Bruins, and the 1990s Red Wings. All three teams were dominant teams that scored a lot of goals and did not allow many shots at their own end of the ice.
Six of the 20 goalies are in the Hall of Fame or will be when they retire (Dryden, Cheevers, Plante, Fuhr, Giacomin, Brodeur). If we increased the minimum games played to qualify we would catch a couple more (Ed Belfour .887, Patrick Roy .888). A few others, like Vernon, Moog, and Tom Barrasso (who just missed making the list) have been in Hall of Fame discussions or at least have sparked Hall of Fame debate. There are even some crazy Detroit fans out there who will do their best to try to convince you of the merits of Chris Osgood.
Playing on a strong team helps pad a goalie's win totals, and it brings them extra attention. It also sets them up for the postseason success that is an excessively important criteria in the way most people rank goalies (and regrettably, this group apparently includes the Hall of Fame voters). Win thresholds illustrate the unfairness of comparing win totals across goalies, and when combined with other performance statistics they can help us get a better sense of who was driving results on their team and who was just along for the ride.
The goalies with the hardest jobs are coming tomorrow. Stay tuned to see how many Hall of Famers are on that list...
Sunday, November 8, 2009
Team Effects on Goalies
I've been playing around with my win threshold stat lately. Through the Hockey Summary Project and as a result of a new book by Sebastien Tremblay, we now have shots against data for every NHL season since 1954-55. That opens the door for a complete statistical analysis, both at the team level and at the individual goalie level.
Since the primary focus of this blog is team effects on goalies, that was the first area I looked at. Here are the correlation coefficients between each team's win threshold and save percentage (both figures adjusted for league scoring levels):
The Original Six Era (1955-1967): -0.545
The Expansion Era (1968-1979): -0.394
The Open Eighties (1980-1990): -0.306
The Talent Influx* (1991-1997): -0.133
The Dead Puck Era (1998-2004): -0.081
Post-Lockout NHL (2006-2009): 0.014
Over most of the NHL's history, the teams that scored the most goals and prevented the most shots have also tended to have the goalies with the best numbers. It is only over the last two decades that we have seen increasing independence between team results and goalie results. That is not to say that there is none of that in recent years, simply that when looking at the overall picture we would expect more of a team impact on the numbers of a goalie playing in the 1960s or 1970s than on a goalie playing today.
Part of this could have been that the better teams had more of a tendency to develop or acquire the top goaltenders in the past. However, the evidence to me suggests that shot quality effects are mostly determined by differences in skill rather than differences in style of play, and therefore shot quality effects are going to be largest in an unbalanced league with large differences in skill between the top and bottom teams. That is supported by the data above, since in today's salary-capped league we don't see the same degree of goalie/team stat dependence, whereas in leagues that were more unbalanced because of factors like expansion, territorial rights or management competence, the goalie and team numbers are far more intertwined.
I have a few posts coming up on the topic of win thresholds, including which goalies had the lowest and highest career numbers, the importance of goaltending through different periods of league history, and how well win threshold numbers predict playoff results.
(*-I'm planning to look at a few different metrics broken down by era, and I wasn't really sure what to call the transitional period between the high-scoring 1980s and the low-scoring late '90s/early '00s. I'm not aware of any term that is in common use to describe the period, but if there is hopefully somebody can let me know. In my opinion the most defining part of the early 1990s was the migration of new talent into the NHL that really broke the Canadian dominance of the league. More Americans started playing the game at the highest level, while the fall of communism and escalating player salaries also attracted more of the top European players. At the same time, there was an overall improvement in the level of goaltending around the league, with a new generation of goalies breaking in and mostly displacing the generation before them.)
Tuesday, November 3, 2009
Dominik Hasek's Decline
It is very difficult to be a great player for a long time at the highest level of hockey. Aging, the force of competition, and overall evolution of the game usually end up gradually pulling them back to the pack, a process that can be accelerated by injuries, coaching strategies or team environments. We have seen some of the league's best players go from special to ordinary because of injuries, Eric Lindros being one of the most extreme examples. When that happens it is obvious to everyone that the player is a shadow of their former selves.
Sometimes the descent is a little more difficult to pick out. There have been players who went from special to merely very good because of injury. Wayne Gretzky's injury in the 1991 Canada Cup has often been used to explain his late career scoring drop, for example. For Gretzky, a "drop" still meant being among the league leaders in assists every year, but in his later career the Great One was not nearly the same goalscorer or even-strength offensive player that he was in his prime.
I think one overlooked example of this latter type of injury was Dominik Hasek's groin injury in 2000. The numbers suggest the injury was what ended the Dominator's peak. Many people consider the 2000, 2001, and 2002 seasons to be part of Hasek's prime, but I don't believe that is correct.
To demonstrate this point, we need to look at the situational breakdowns. There were a couple of things going on in the early '00s that were inflating Hasek's numbers: A league that was gradually becoming more low-scoring, and a Buffalo Sabres team with improved team discipline that took fewer penalties. Let's look at Hasek's even-strength save percentages:
1998-99: .946
1999-00: .923
2000-01: .924
2001-02: .925
We don't have official even-strength save percentages from before 1998-99, but based on my estimates from Hasek's overall save percentage and the number of power plays the Sabres faced I'm quite sure they were much closer to .946 than .925. In 1997-98, for example, NHL.com has the goals against by situation, although the shots faced totals aren't correct. However, if we assume that Hasek faced the same number of even strength shots against in 1997-98 as he would in 1998-99, his even strength save percentage would have been .938. That assumption is unrealistic, given that Hasek played more minutes and faced more shots per game in 1997-98 than he did in 1998-99. Hasek was probably performing at .940+ in terms of EV SV% in '97-98, and he was likely in or near that range for the entire period from 1993-94 to 1998-99.
If old age was the reason for the drop from '90s Hasek to '00s Hasek, then we would have expected a more gradual decline. There was essentially a sudden drop from a high peak to a lower plateau, which fits the pattern of a player reduced by an injury.
Hasek's even-strength numbers recovered post-lockout to the .930 range. Perhaps that year off allowed him to heal some of the old battle scars and revert to the Dominator of old, at least for half a season. After that, another injury at the Olympics and the effects of old age caught up with him, even though Hasek was still an effective goalie pretty much right up until the end.
I have heard it argued that comparing Hasek's Buffalo numbers with his numbers in Detroit show that it is more difficult to dominate as a goaltender on a strong team, but I think that is wrong. Hasek's numbers dropped in Detroit partly because the Red Wings took a lot more penalties than the Sabres, and partly because he was not the same goalie that he was at his peak.
It is not surprising that Hasek ran into injury trouble, given that his style had to have been one of the most physically demanding styles of any goalie to ever play. He usually played a straight butterfly on the first shot, which applies the usual stress on the groin and hips, and then he also added his special brand of post-save moves and close-save tactics that required extreme agility and flexibility. Unfortunately, injuries often follow athletes who play a style nobody else is able to play (think of guys like Orr, Lindros, Forsberg, etc.), and the same thing was true for the Dominator.
Subscribe to:
Posts (Atom)